|
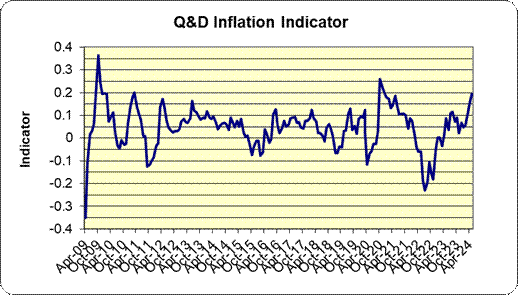
“Q&D” stands for “quick and dirty.” As the name implies, this is an inflation-based indicator that is easily calculated (no computer necessary). Although the link between inflation and the stock market has been generally noted by observers, to my knowledge the following is an original way to generate buy/sell signals based on inflation.
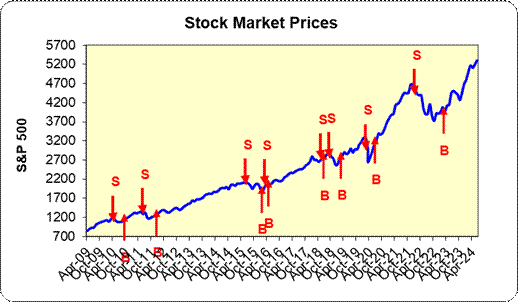
The charts show the behavior of the indicator over the last 5 years. Interpreting the indicator is straight forward: Each time the indicator crosses the 0 line to positive territory it is a “BUY” signal. When the indicator crosses the 0 line to negative territory it is a “SELL” signal. (A few of the Indicator recommendations are shown on the chart.)


Here is how to calculate the Q&D Inflation Indicator: Each month, simply subtract the 6 month inflation rate from the 6 months percentage change in stock prices. The result is the indicator.
The indicator is not based on any correlation or any other statistical measure. Yet, given its simplicity, it was amazingly accurate during recent years (although by no means perfect).
Details…Details… The inflation of a given month is announced on the following month. We have taken this into account. For example, by the end of September we know the inflation rate through August, and subtract this from the market gain through September. Also note that we need to anticipate when the indicator crosses 0. But this is not difficult given the fact that we use 6 months rates. For stock prices we use the average of the daily closing prices of the S&P 500 Index. For inflation we use the CPI, available here.
Why does it work? The Q&D Inflation indicator is part technical, part fundament. Technically, it is a warning of a change in trend. Fundamentally, when inflation accelerates it usually indicates a tighter monetary policy, and vice versa. It may be considered an indication of stagflation, which the stock market abhors.
I first proposed the idea of the Q&D Inflation Indicator (in a somewhat more complicated form) in my newsletter Arie Vilner’s Rational Investment Outlook in October 1991.
|
